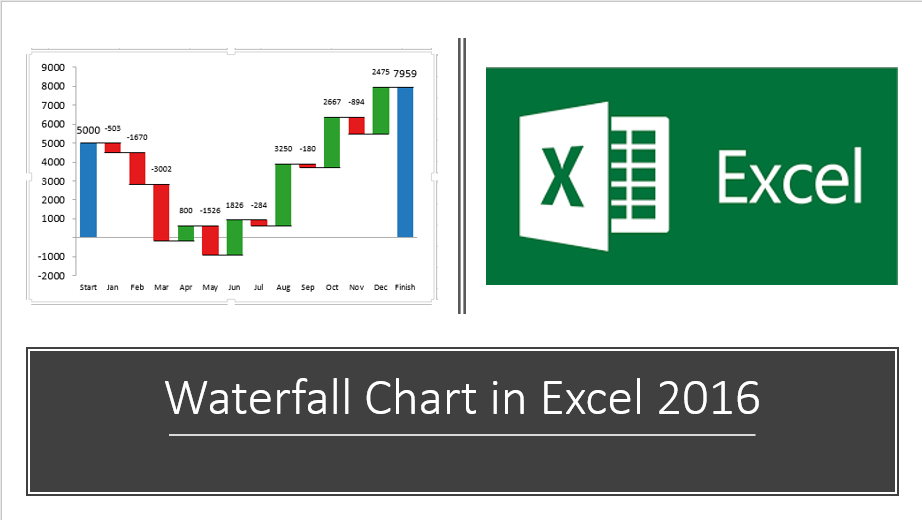
Blog

How to Create a Histogram Chart in Excel

According to Investopedia, “a Histogram is a graphical representation, similar to a bar chart in structure, that organizes a group of data points into user-specified ranges. The histogram condenses a data series into an easily interpreted visual by taking many data points and grouping them into logical ranges or bins”. In other words, Histogram is a type of …

How to Create a Histogram Chart in Excel Read More »

Pareto Chart

Pareto charts are extremely useful for analyzing what problem needs attention first, the taller bars on the chart, which represent frequency and the line shows the cumulative frequency percentage. The Pareto principle (also known as the 80/20 rule), states that, for many events, roughly 80% of the effects come from 20% of the causes. Let’s …

Pareto Chart Read More »

Custom Number Formatting

Custom Number Formatting- Sometimes when you download or import any data into Excel, its formatting looks weird. Dates get converted to numbers or Numbers are showing in scientific characters (2.34568E+12), Decimal points, Currency symbols, convert number into percentage, friction, Text format etc. For these unexpected formats we have a listed options available in under “Number …

Custom Number Formatting Read More »