Have any question?
(+91) 9899366218
info@nurturetechacademy.in
Register Login
No apps configured. Please contact your administrator.

Login with your site account

Lost your password?

Not a member yet? Register now

Nurture Tech Academy Nurture Tech Academy
  • Excel Course
  • Corporate Training
  • Portfolio
  • Blog
  • Excel Assessment
  • Contact
    • Cart

      0
  • Excel Course
  • Corporate Training
  • Portfolio
  • Blog
  • Excel Assessment
  • Contact

Blog Excel

  • Home
  • Excel
  • How To Handle Missing Data In Excel Charts

How To Handle Missing Data In Excel Charts

  • Posted by Lokesh Lalwani
  • Categories Excel
  • Date July 13, 2016
  • Comments 0 comment

How To Handle Missing Data In Excel Charts !!!


Ever come across a situation when you have some blanks in data for which you need to create a chart for? Or have any hidden rows or columns in the data? We know that it is very logical how excel create a chart in this situation but sometimes we don’t want to present it in that way. So just to get rid of this we can use one of the below smartest options.

So let’s start guy’s, Just have a look at the data and the chart we are going to use to understand this.  (You can also download the exercise file by following the link at the bottom of this post)


1


2


Click anywhere inside the chart to select it. Now you can see the Chart Tools group in the ribbon.


3


Under Design Tab -> Select Data


4


Inside the Select Data Source, click on “Hidden and Empty Cells”


5


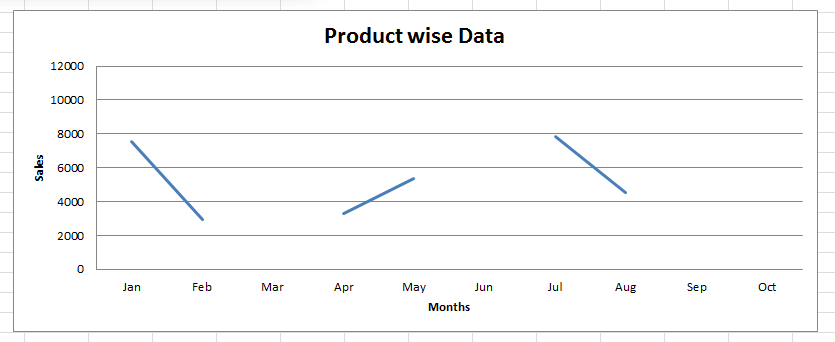
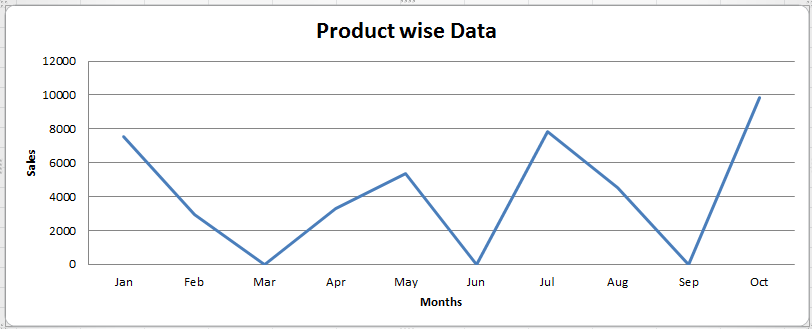
Now in “Hidden and Empty Cell Settings”, you can see here that “Gaps” are selected by default.  Here we can either choose “Zero” or “Connect Data points with Line”. Just look at the below screen shots for both options.

Filling Gaps using “Zero” option.


6


Filling Gaps using “Connect data points with line” option.


7


It entirely depends on how you want to present the chart, accordingly you can use “Zero” or “Connect Data points with Line”.

You can download the Excel file used for this Post here….


450 total views, 3 views today

Tag:Bar Chart, Charts, Column Chart, Excel, Graphs, Microsoft, Missing Data

  • Tweet
  • Pinterest
Lokesh Lalwani
    Hey there, I am Lokesh Lalwani. I just love Excel and that is why i am here. We founded Nurture Tech Academy with only one goal in mind to make you SUPERHERO in Excel, Yes and that's true. Here at Nurture Tech Academy we work all day and make some impressive Excel Videos, Blog Posts and other stuff just to take you one step closer to become a Smart Excel user.

    Previous post

    Count Number of Workdays in a given period
    July 13, 2016

    Next post

    How to Create a Dependent drop down list
    16 July, 2016

    You may also like

    • Heat Map Chart through Radio Button in Excel
      27 December, 2018
    • How to Create a Histogram Chart in Excel
      22 November, 2018
    • Count Functions in MS Excel
      12 November, 2018

    Leave A Reply Cancel reply

    Your email address will not be published. Required fields are marked *

    Join our Newsletter

    Latest Courses

    Excel – Beginner to Advanced (In-depth)

    Excel – Beginner to Advanced (In-depth)

    ₹5,990.00

    logo-eduma-the-best-lms-wordpress-theme

    (+91) 9899 366 218

    info@nurturetechacademy.in

    Other

    • Blog
    • Corporate Training
    • Portfolio
    • Contact

    Learn MS Excel

    Microsoft Excel Learning
    Learn MS Excel Online

    Corporate Training

    Online Corporate Training Programs
    Corporate Training Companies in Delhi

    Online Training

    MS Excel Training Courses
    MS Excel Online Training
    MS Excel Course Online Training
    MS Excel Online Training in Delhi
    Join our Newsletter
    Why Wait? Start with our awesome Excel updates for free....