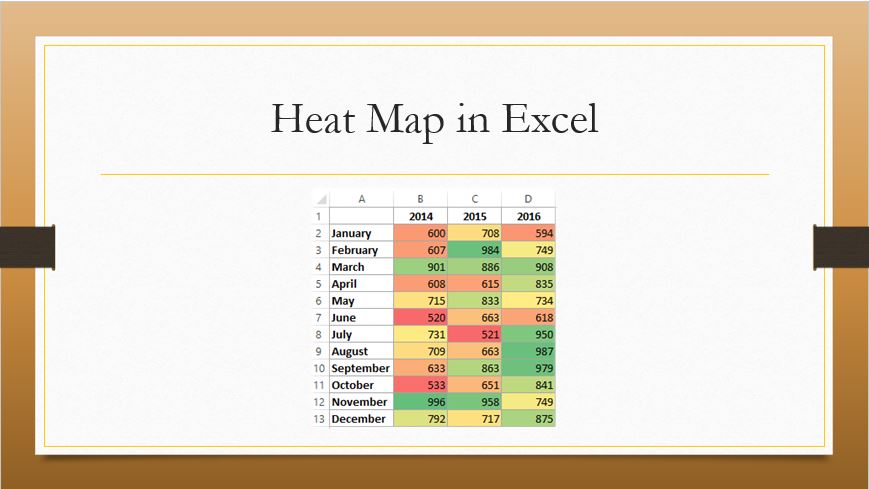
Heat Map Chart through Radio Button in Excel-
If we wish to highlight Top and bottom values in excel along with colour, rather than finding it manually, simply we will use conditional formatting.
Today we will discuss a different way
![]()

Heat Map Chart through Radio Button in Excel-
If we wish to highlight Top and bottom values in excel along with colour, rather than finding it manually, simply we will use conditional formatting.
Today we will discuss a different way
![]()
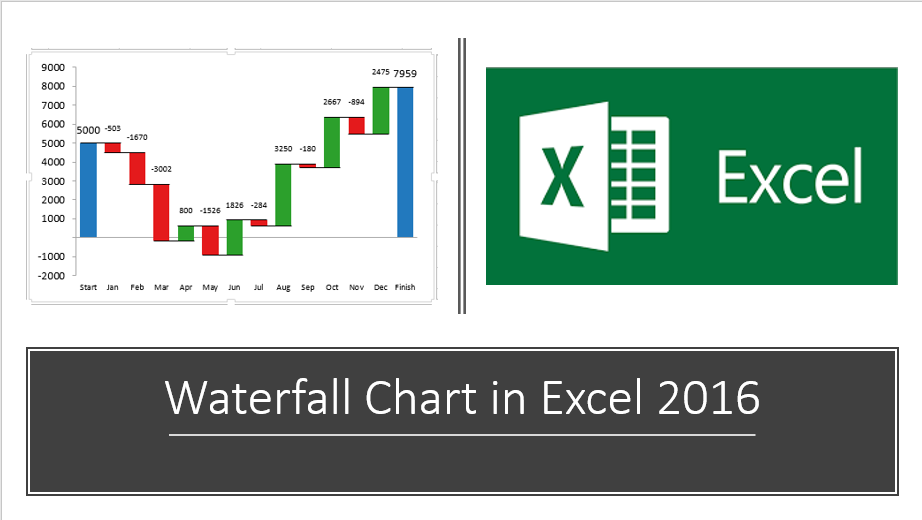
Microsoft Excel has lots of predefined charts to visualize the data like Column, Pie, Line etc. In the new version of Ms-office i.e. 2016 or 365, six new charts have been introduced by Microsoft. In this blog post, we are
![]()
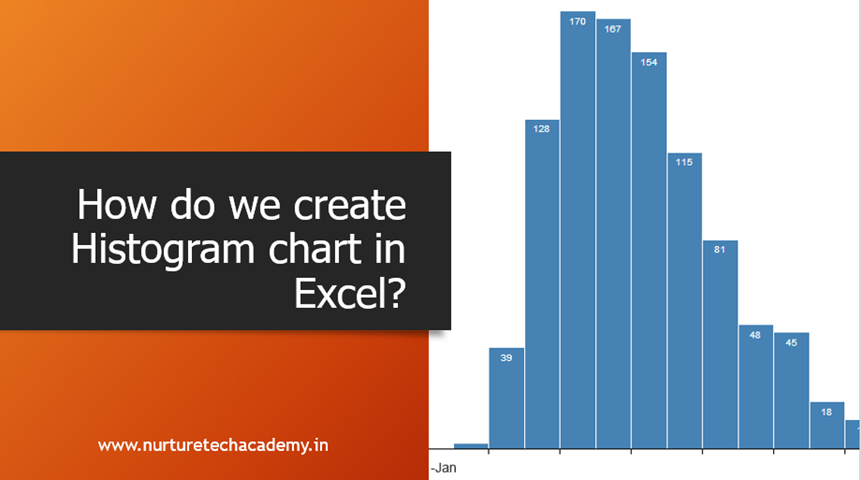
According to Investopedia, “a Histogram is a graphical representation, similar to a bar chart in structure, that organizes a group of data points into user-specified ranges. The histogram condenses a data series into an easily interpreted visual by taking many data points and
![]()
The requirement of counting is almost always present in our day to day job and Excel made it really easy for us by giving a number of counting functions like Count, CountA, CountBlank, CountIf and CountIfs. Let’s understand them in
![]()
Power Query is an amazing tool to import data from almost any popular or semi-popular data source in Excel. One can import any database, which can be in any format like .txt, CSV, JSON, Access etc. or from any database
![]()
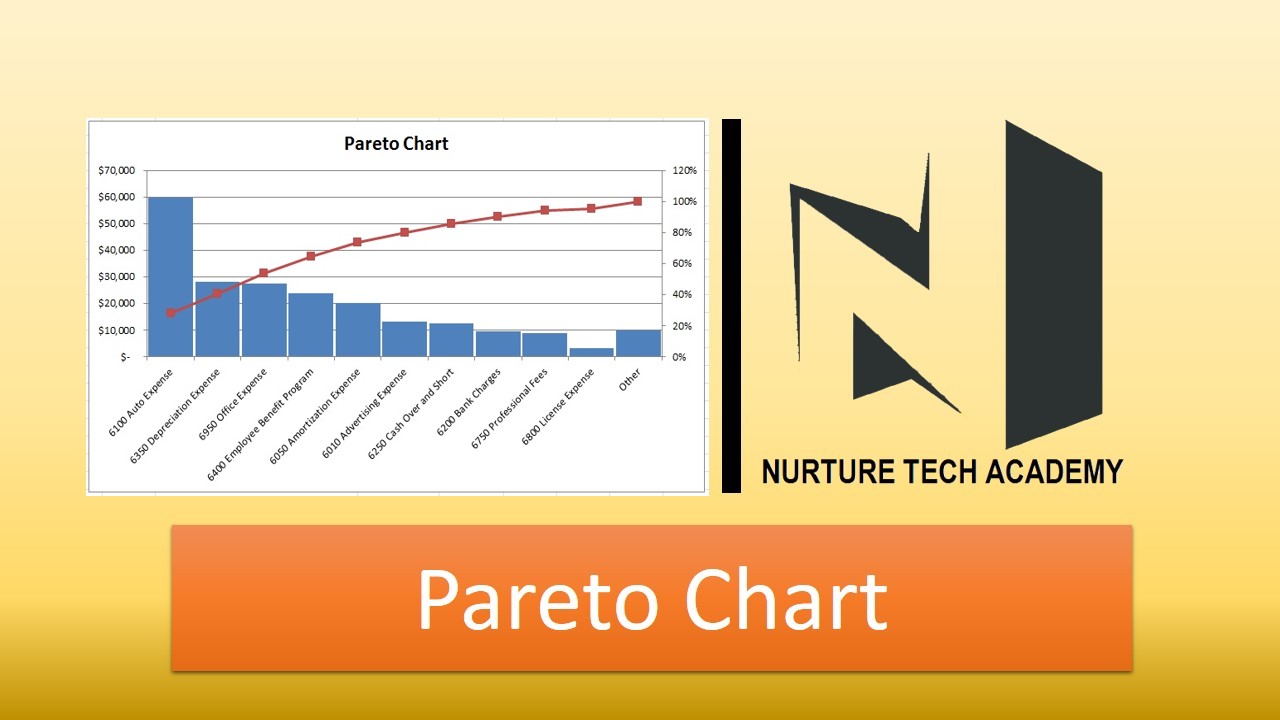
Pareto charts are extremely useful for analyzing what problem needs attention first, the taller bars on the chart, which represent frequency and the line shows the cumulative frequency percentage.
The Pareto principle (also known as the 80/20 rule), states that,
![]()
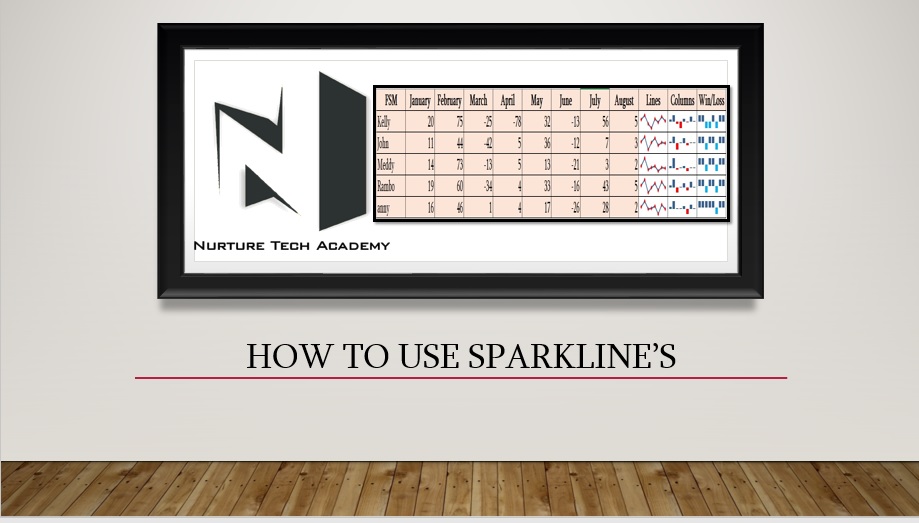
How to use Sparkline in Excel?
Charts are the Graphical visualization in excel which help us to understand the weekly, monthly performance and consolidated report of entire data, However if we have a data in to tabular form and we
![]()

Hi All,
Do you know apart from only copy and pasting the whole content with formatting in Excel, we can paste a certain attribute such as Value only, Column Width, Formula only, formatting or comment in Excel.
Paste specials give
![]()

Custom Number Formatting-
Sometimes when you download or import any data into Excel, its formatting looks weird. Dates get converted to numbers or Numbers are showing in scientific characters (2.34568E+12), Decimal points, Currency symbols, convert number into percentage, friction, Text
![]()

Use of SUMIF function in Excel-
SUMIF helps to sum up values only once it matches certain criteria. It can be used to add numbers based on criteria’s like Text, Number and Dates, also can use with logical operators (=,<>,>,<
![]()